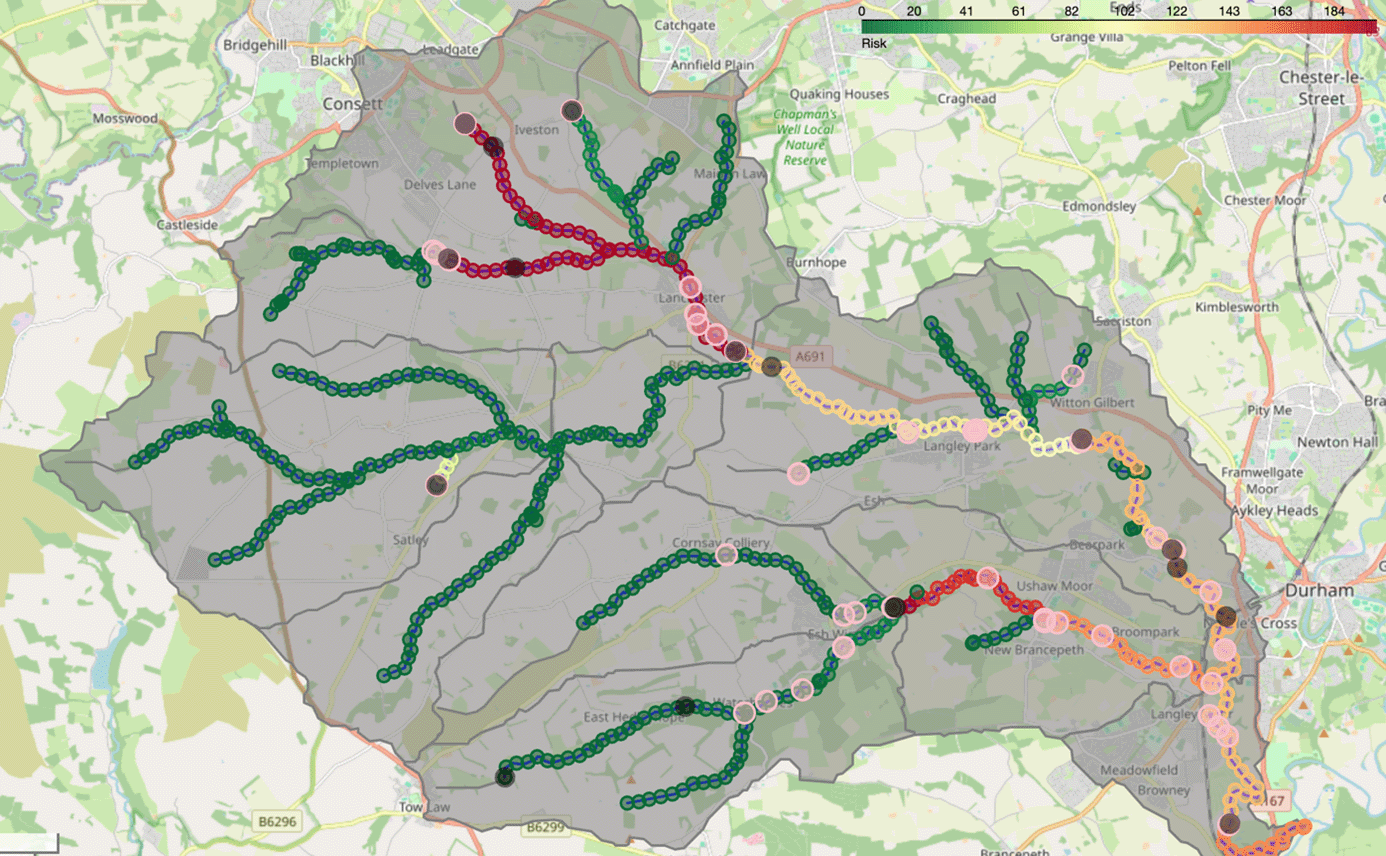


As part of River Deep Mountain AI, we are now releasing the first iteration of our Open Risk Map on GitHub. Our risk map enables stakeholders to quickly collate different pollution data sources and to get an overview of potential pollution hotspots across river catchments.
Water companies, catchment managers and other stakeholders face significant time and financial outgoings when attempting to design and implement water quality monitoring schemes within a catchment. Furthermore, it can be challenging to determine which sources of pollution represent the highest risk at different locations within a catchment, without prior water quality monitoring.
To address these challenges, River Deep Mountain AI is providing a standardised and open approach to produce catchment-wide 'risk maps', helping to highlight areas where pollutants (e.g. phosphorus) pose a higher threat to river water quality.
Our Open Risk Map can be used to inform where further on-the-ground walkovers may be needed and help highlight the optimal locations for targeting water quality investigations and monitoring.
Utilising openly available data to map phosphorous hotspots
Our Open Risk Map is built up of individual ‘risk layers’, each of which aligns with a particular type (e.g. phosphorus) and source (e.g. combined sewer overflows, final effluent from treatment works, agricultural pollution, etc.) of pollution. Each ‘risk layer’ ingests openly available data to calculate a standardised ‘risk value’, which can be added to a baseline catchment map. Our Open Risk Map then determines how the level of risk varies throughout the river catchment system.