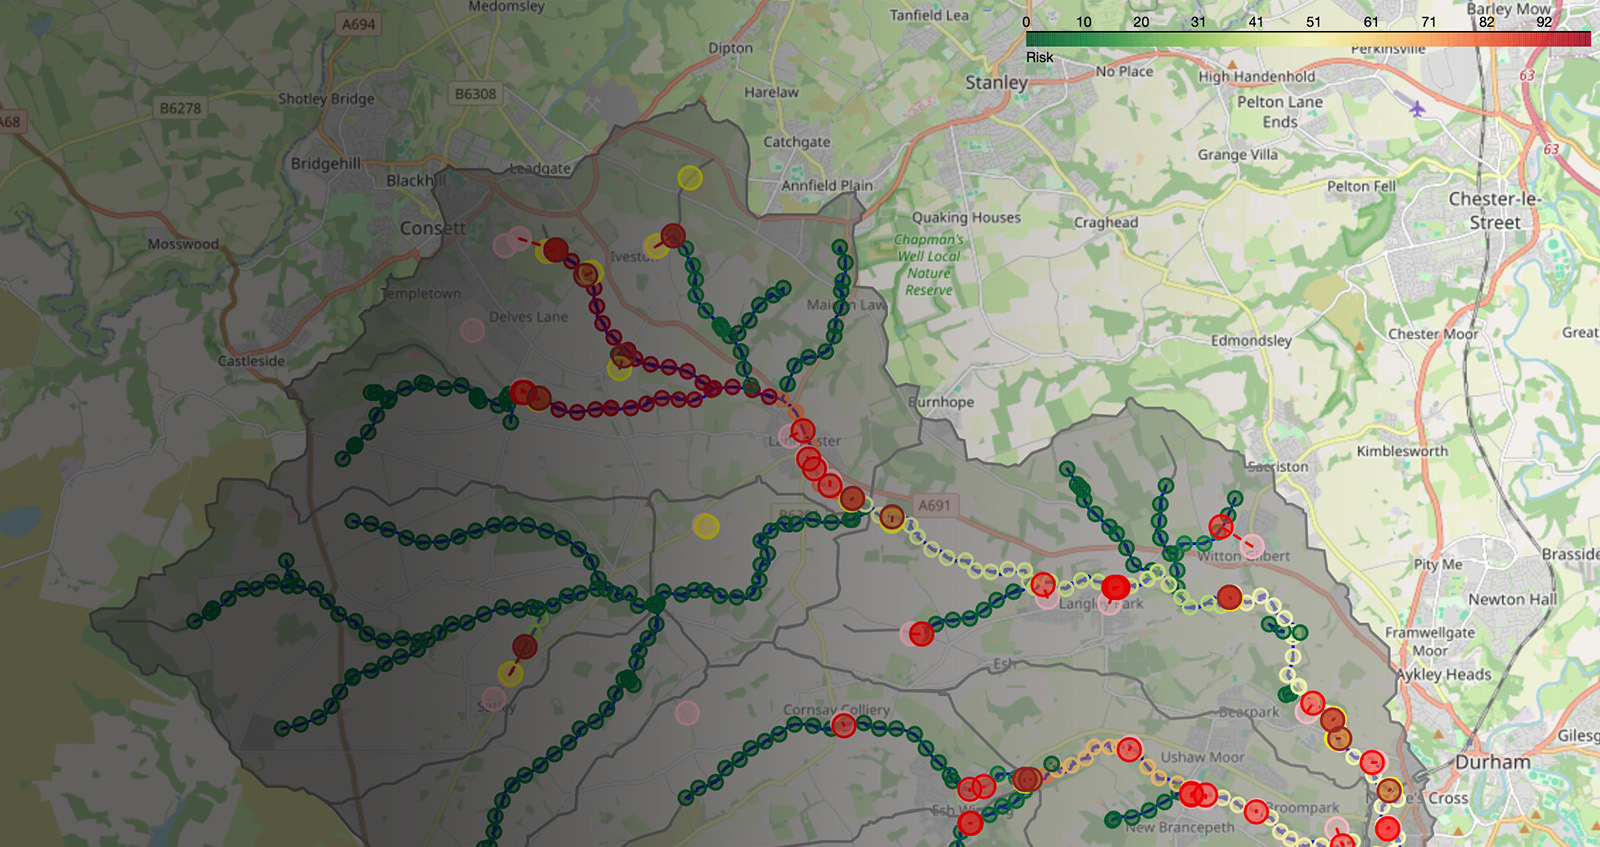
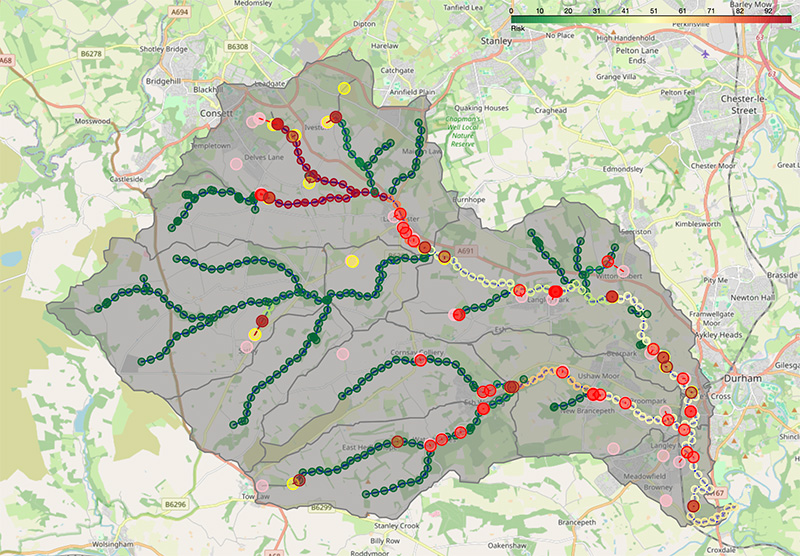
The Open River Network (ORN) is used to create our baseline waterbody layer within the Open Risk Map, to which pollution sources can be attributed.
In our first model iteration (released in June 2025), we focussed on creating a risk map of active phosphorus (orthophosphate P). Phosphorus is a high-priority pollutant that has significant impact on the ecological health of rivers. Our first model iteration relied only on data for wastewater treatment works (WwTWs) and combined sewer overflows (CSOs) to estimate the annual phosphorous load entering a river catchment at different locations.
This load is converted to a concentration within the river channel, and a proportional risk value is calculated using the UKTAG Revised Standard value for ‘poor’ water quality (or an equivalent standard). This methodology is followed so that the risks associated with different pollutant types (e.g. phosphorus, nitrate, etc.) can be normalised and compared in our model development process.
Since this first release of the Open Risk Map, we have introduced additional risk layers to our map, including land use, livestock and urban runoff to further enhance the risk calculations. Furthermore, we have introduced ammoniacal nitrogen as an additional pollutant type. Together, this provides a more holistic overview of any given catchment, ahead of designing or planning detailed monitoring schemes or interventions. The risk maps also provide stakeholders with a high-level overview of pollution source apportionment.
The latest version of our Open Risk Map has also undergone a series of validation exercises to test its capabilities as a simplistic source apportionment tool. Our validation approach focussed on a more qualitative assessment of the Open Risk Map, highlighting where the model performs well and where it could be improved. During this validation, we compared the predicted concentrations (of reactive orthophosphate as P and Ammoniacal N) with in-situ measured concentrations. Overall, the model performs well, generally providing users with a representative view of water quality risk within most catchments.
The Open Risk Map has also undergone a benchmarking assessment, comparing its performance against those of similar industry standard tools. Here, the risk map calculated concentrations of orthophosphate P for points distributed over 12 catchments across England (representative of the national ranges of rainfall, baseflow index, catchment sizes, urbanised area, etc.) were compared to Source Apportionment-GIS (SAGIS) estimates and Environment Agency (EA) measures of orthophosphate P. Preliminary results show that the risk map performance in representing average EA measurements of orthophosphate is similar to that of SAGIS for the dataset assessed.
The outcomes of the validation and benchmarking assessments highlight the potential for the risk maps to represent water quality risk in catchments, particularly given the accessibility of the risk map and input data compared to alternative tools.
The full approach, results and specific cases of the validation is detailed in the model output report shared alongside the Open Risk Map on GitHub.
A collaborative and open-sourced approach
The overarching objective of River Deep Mountain AI is to bring key stakeholders involved in waterbody health together and collaboratively develop open-source AI/ML and remote-sensing models that can inform effective actions to tackle waterbody pollution.
All our models will be released open source to democratise artificial intelligence and to benefit the entire water sector. The first iterations of our models were released in May 2025, and the second iterations are now being released.
River Deep Mountain AI is funded by the Ofwat Innovation Fund and consists of 6 core partners: Northumbrian Water, Cognizant Ocean, Xylem Inc, Water Research Centre Limited, The Rivers Trust and ADAS. The project is further supported by 6 water companies across the United Kingdom and Ireland.