April 9, 2026
How We Built a Multi-Agent System with neuro-san to Score Formula 1 Fan Submissions

Who's The Ultimate F1 Fan: How We Built a Multi-Agent System with neuro-san to Score Formula 1 Fan Submissions
A deep dive into designing and scaling a multi-agent AI system that evaluates fan submissions across knowledge, enthusiasm, and humor using neuro-San.
The Starting Line
Formula 1 isn't just a sport - it's a culture. From the roar of the engines at Monza to the late-night strategy debates on Reddit, F1 fans live and breathe racing. But here's a question that's harder to answer than you'd think: who's the biggest fan?
Imagine running a contest where thousands of F1 fans submit short descriptions of why they deserve the title of ultimate fan. Now imagine reading every single one. Evaluating passion. Gauging actual knowledge. Appreciating the ones that make you laugh. Doing it fairly, consistently, and at scale.
That's the challenge we set out to solve with f1-fan-eval - a scalable, multi-agent AI evaluation system that reads fan submissions and scores them across three dimensions: Knowledge, Enthusiasm, and Humor. Each dimension is evaluated by a specialized AI agent, orchestrated by neuro-san, Cognizant AI Lab's multi-agent accelerator framework. The results are stored in a database, processed through a distributed pipeline, and visualized in interactive dashboards - all built to handle anything from a dozen submissions to tens of thousands.
Why Three Dimensions?
Not all fandom is created equal. A fan who can recite every World Champion since 1950 is impressive, but are they fun? Someone who writes "LIGHTS OUT AND AWAY WE GO!!!" with twelve exclamation marks clearly has spirit, but do they actually know what DRS stands for?
We designed three evaluation dimensions to capture the full spectrum of what makes a great F1 fan:
Knowledge - Does the fan demonstrate real F1 understanding? Can they speak to tire strategy, the hybrid era, team dynamics, and driver rivalries with accuracy and depth? Or are they just saying "cars go fast"?
Enthusiasm - Is the passion real? Does the writing convey genuine excitement, emotional connection to the sport, and the kind of energy that makes you want to watch the next race?
Humor - Is it entertaining? Does the submission make you smile? Bonus points for clever use of F1 terminology, good comedic timing, and memorable one-liners.
Each dimension is scored on a 1–100 scale, and each score is itself the average of 10 sub-criteria evaluations - giving the system nuance and granularity that a single number never could.
The Architecture: How It All Fits Together
The system follows a clean pipeline architecture, separating concerns between ingestion, evaluation, storage, and visualization:
Fan Submissions (input data)
       |
  [ Input Processing ]  -->  Parse, normalize, detect encoding
       |
  [ Database: Submissions ]
       |
  [ Evaluation Pipeline ]  -->  3 AI agents score each submission
       |                        (knowledge, enthusiasm, humor)
  [ Database: Evaluations ]
       |
  [ Dash Dashboard ]  -->  Histograms, radar charts, performance metrics
The beauty of this architecture is its composability. Each layer is independent. You can swap SQLite for PostgreSQL, run evaluations locally or distribute them across Celery workers, and add new scoring dimensions without touching existing ones.
Key Components
neuro-san AI Agent networks - Three specialized agent networks defined in declarative HOCON configuration files. Each agent knows its rubric, its sub-criteria, and how to score. No Python code changes needed to tweak evaluation logic - just edit the HOCON file.
Evaluation Orchestrator - An async Python pipeline that creates one AI client per dimension per submission, calls all three agents, aggregates scores and token metrics, and stores the results. Concurrency is controlled via semaphore to avoid overwhelming the neuro-san agents.
Celery + Redis - For production scale. Input processing and evaluation are separate task queues, each with configurable worker concurrency. Process 10 submissions or 10,000 - the architecture handles both.
Dash Dashboard - Four interactive pages for exploring results: raw data tables, score distributions (histograms and boxplots), radar chart comparisons, and system performance metrics (tokens, cost, processing time).
The Agents: One Per Dimension, Explainability Built In
A core design principle borrowed from earlier works on neuro-san-studio - a multi-agent system for evaluating hackathon code submissions - is: one agent per rubric dimension. This separation is intentional and critical for explainability.
When the Knowledge agent gives a submission a score of 23, you can read exactly why: which of the 10 sub-criteria pulled it down, and what the agent's rationale was. There's no black-box aggregate. Each agent owns its dimension end-to-end.
How an Agent Scores
Take the Knowledge agent as an example. When it receives a fan submission, it evaluates across 10 sub-criteria:
Accuracy of F1 facts (drivers, teams, circuits, eras)
Understanding of race strategy or technical aspects
Historical context awareness
Knowledge of team dynamics and rivalries
Recognition of driver skill and style
Awareness of modern trends (current grid, regulations)
Use of correct F1 terminology and jargon
Balance of objectivity vs fandom bias
Depth of insight despite brevity
Overall impression of F1 expertise
Each sub-criterion gets a score from 1 to 100. The 10 scores are averaged to produce the final Knowledge score. The agent also generates a brief text rationale explaining its assessment.
The Enthusiasm and Humor agents follow the same pattern with their own specialized sub-criteria - measuring things like "emotional connection to F1 history" and "originality of humor" respectively.
The Scoring Rubric
All agents share a consistent rubric scale:
| Range | Rating | Description |
1–30 | Poor | Lacks accuracy/depth, generic or confused |
31–50 | Below Average | Some relevant content, but superficial |
51–70 | Average to Good | Solid understanding, reasonably accurate |
71–89 | Strong | Knowledgeable, specific, engaging |
90–100 | Exceptional | Expert-level insight, memorable |
Agents are explicitly instructed to use the full 1–100 range, penalize vague or generic statements, and reserve 90+ for truly exceptional responses. This avoids the common pitfall of AI evaluators clustering everything around 60–80.
Deterministic Scores from Non-Deterministic Agents
One of the trickiest challenges with LLM-powered evaluation is ensuring structured, reliable output from inherently probabilistic models. We tackle this through sly_data - a Neuro-san feature that provides a private data channel separate from the chat stream.
Here's the key insight: the agent hierarchy passes scores through sly_data rather than relying on text parsing. The ManageEval coded tool - a Python class invoked by the agent - receives the raw score list, validates each entry (filtering out nulls, NaNs, and invalid values), computes the average, and writes it back to sly_data. This means the mathematical operations - averaging, validation, storage - happen in deterministic Python code, not in the LLM's text output.
This approach drastically reduces the failure rate compared to parsing scores from free-text responses.
Walking Through a Real Evaluation
Let's trace what happens when a fan submits: "I like Michael Schumacher"
Stage 1: AI Evaluation
After the input is parsed, the orchestrator creates three SimpleClient instances - one connected to each agent (f1_fan_knowledge, f1_fan_enthusiasm, f1_fan_humor). Each client sends the fan's text to its agent via HTTP.
The Knowledge agent recognizes a valid driver name but notes the lack of any specific facts, strategy, or context. Sub-criteria scores come back low: perhaps [12, 5, 8, 5, 15, 3, 5, 10, 8, 10]. Average: 8.1.
The Enthusiasm agent detects a personal connection ("I like") but finds minimal emotional depth. Scores might land around [15, 10, 8, 12, 18, 5, 5, 8, 12, 10]. Average: 10.3.
The Humor agent finds nothing intentionally funny. Scores cluster low: average around 5.0.
Each agent also returns a brief rationale, and the system tracks token usage and cost for every API call.
Stage 2: Database Storage
The combined results are written as a single evaluation record:
Field | Value |
knowledge | 8.1 |
enthusiasm | 10.3 |
humor | 5.0 |
brief_description | “knowledge: Mentions Schumacher but lacks depth... enthusiasm: Minimal emotional engagement... humor: No comedic elements detected." |
total_tokens | 4,230 |
total_cost | $0.02 |
total_taken | 12.4s |
Stage 3: Dashboard
The results appear instantly in the Dash app - plotted on histograms, compared via radar charts, and available for drill-down in the raw data table.
What the Data Tells Us
After running evaluations across a batch of submissions, clear patterns emerge in the score distributions.
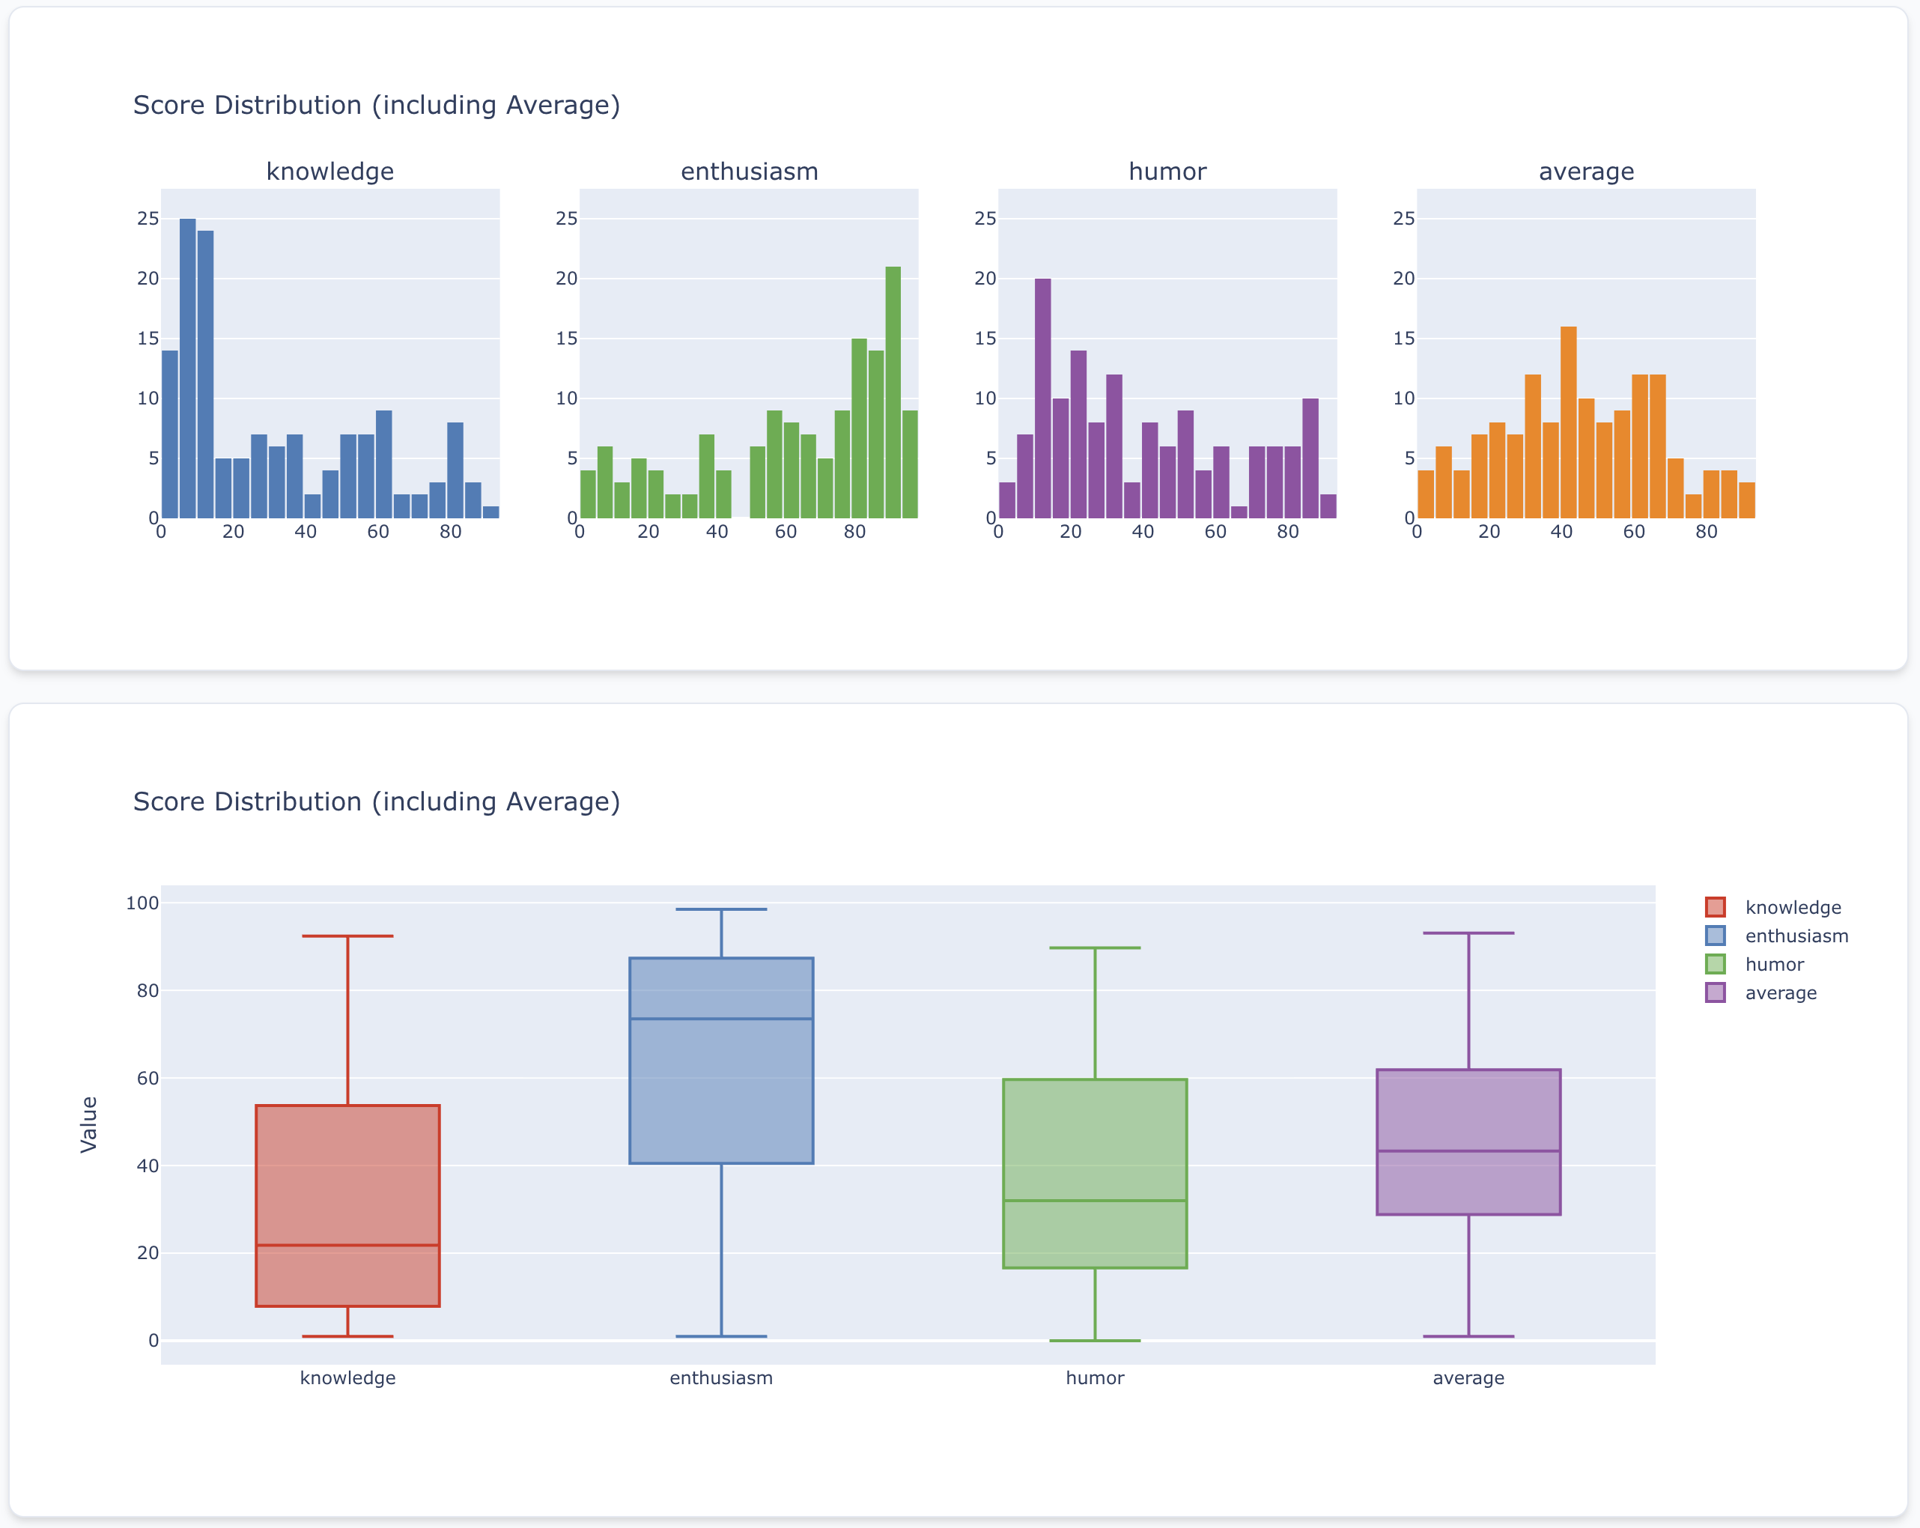
Figure 1. Score distributions across Knowledge, Enthusiasm, Humor, and their Average. Notice how Knowledge skews low (most fans don't demonstrate deep technical understanding), while Enthusiasm shows a bimodal distribution - fans either go all-in or barely try. Humor clusters at the lower end, which makes sense: being genuinely funny in a short text is hard.
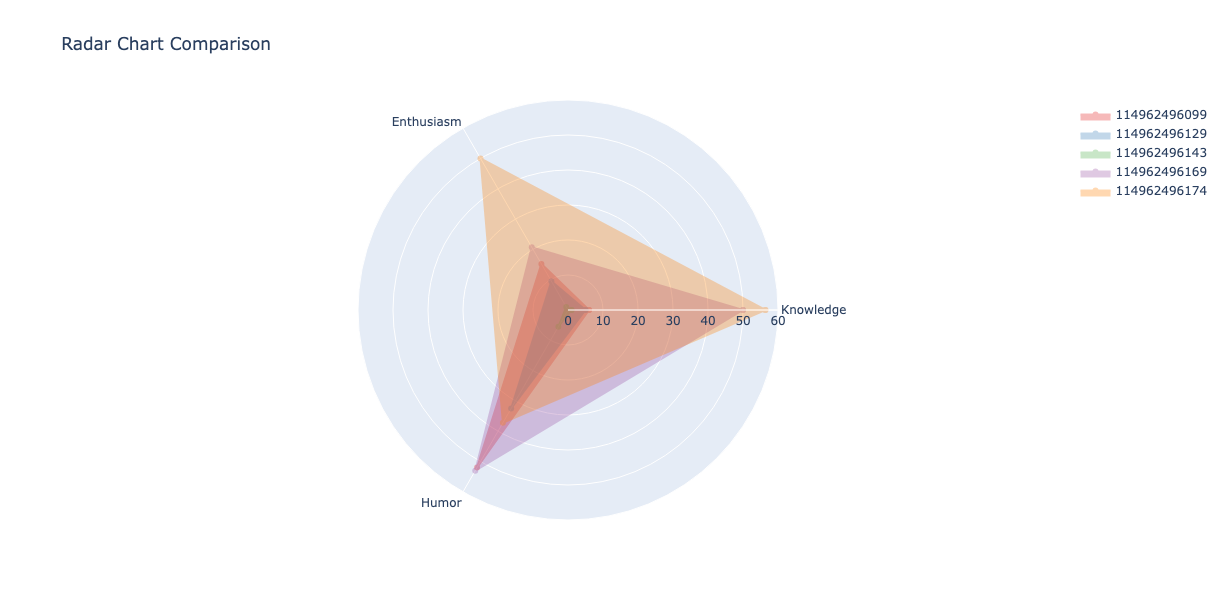
Figure 2. Radar charts comparing individual submissions side by side. Each polygon represents a fan - you can immediately spot the "all-rounders" (balanced shapes) versus the "specialists" (spiky profiles). Submission 114962496174 (orange) shows strong knowledge and enthusiasm but moderate humor.
The Interactive Dashboard
The Dash-powered app provides four ypes of visualizations for exploring evaluation results:
Raw Data - Searchable, sortable tables of all submissions and their evaluations
Score Distribution - Histograms and boxplots showing how scores are distributed across all fans
Radar Comparison - Multi-dimensional radar charts for comparing individual fans head-to-head
System Performance - Token usage, API costs, and processing times
The dashboard is backed by a singleton EvalDataLoader with LRU caching, so it stays responsive even with large datasets.
The nsflow client
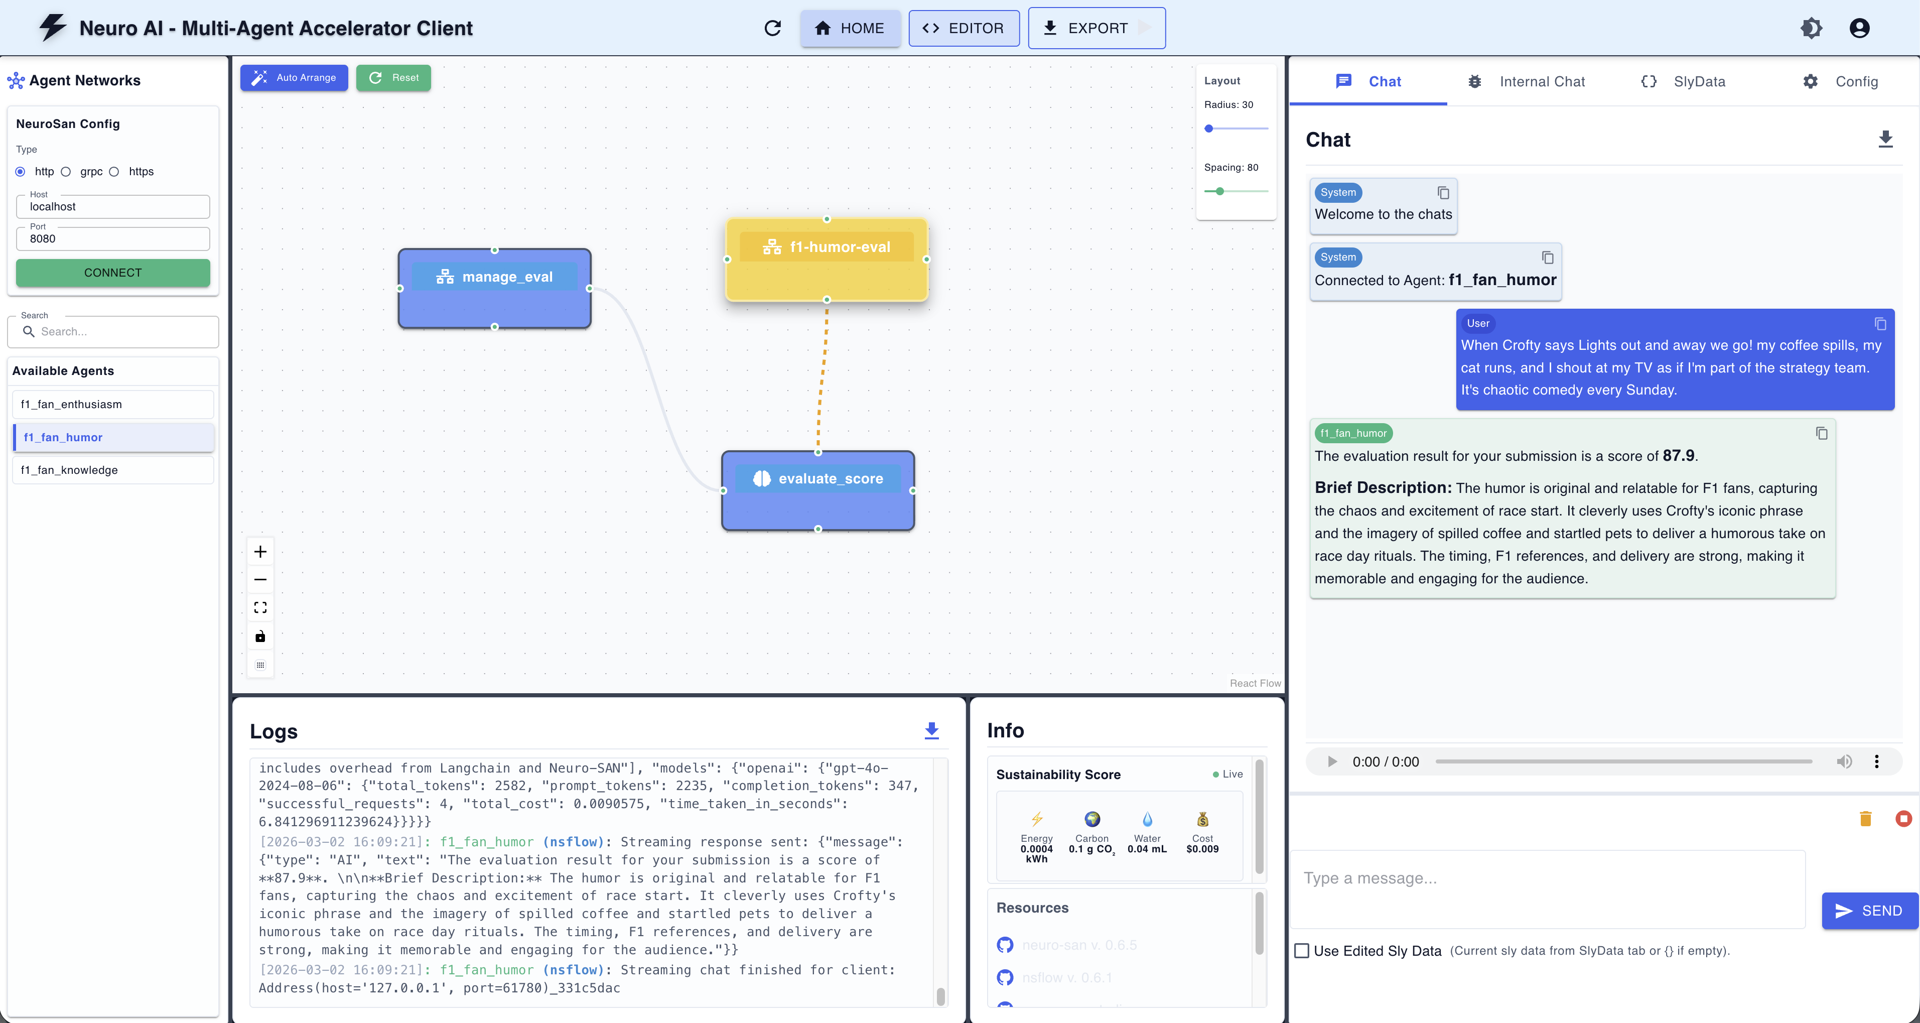
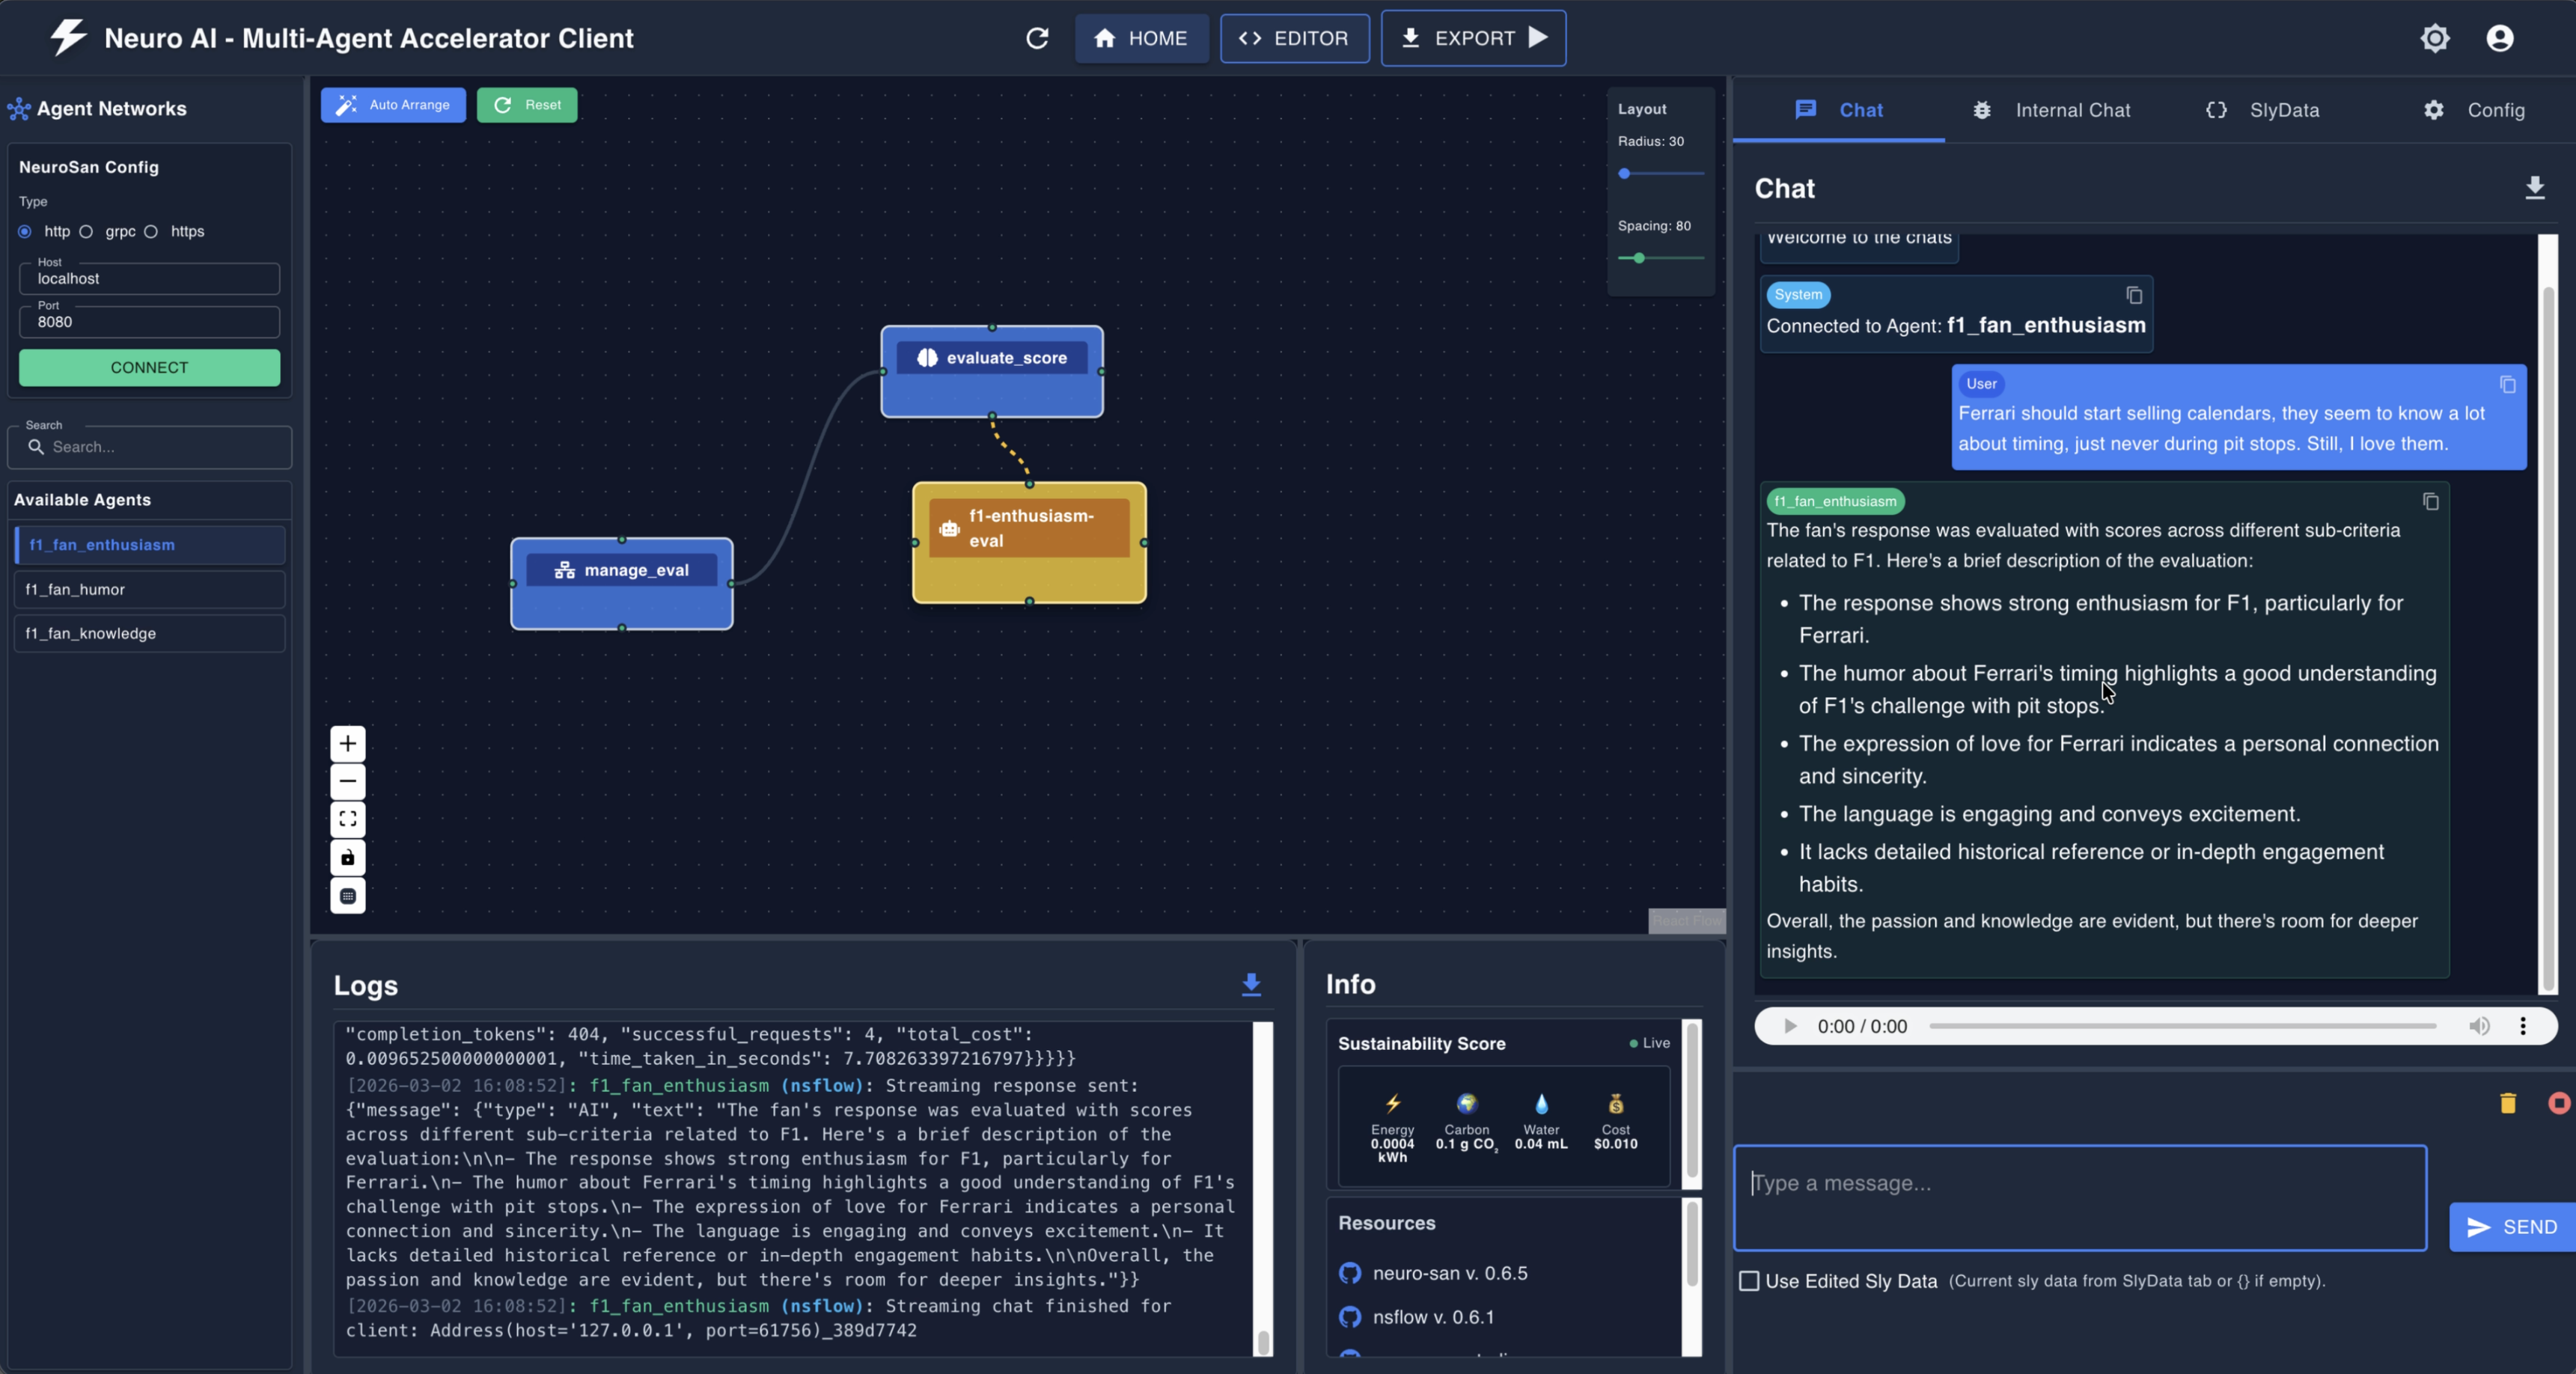
Figure 3. The nsflow UI showing the f1_fan_humor agent network. On the left: the agent graph (f1-humor-eval → evaluate_score → manage_eval). On the right: the live chat showing a scored submission with a brief description. The Logs panel shows the raw API communication. This kind of transparency is invaluable for debugging and tuning agent behavior.
For an interactive walkthrough of the system in action, check out the demo recording below.
Getting Started
The project is designed to be up and running in minutes. Here's how:
1. Clone and install
Clone the repo
git clone <https://github.com/deepsaia/f1-fan-eval.git>
cd f1-fan-eval                                     # go to the project dir
curl -LsSf <https://astral.sh/uv/install.sh> | sh  # install uv, if needed
uv sync                                            # install all dependencies
cp .env.example .env                               # configure environment, if needed
2. Start the neuro-san server
python -m runThis launches the neuro-san server on 127.0.0.1:8080. All three agents (knowledge, enthusiasm, humor) are now ready to receive submissions.
To use the interactive UI, use the --with-ui arg
python -m run --with-uiBy default, this interactive UI can be accessed here: http://127.0.0.1:4173
3. Ingest bulk fan submissions
python input_processor/process_inputs.py --input-source samples/f1_sample.csvThis parses the CSV and writes submissions to the database.
4. Run evaluations
python -m eval.process_eval --overrideThis sends every submission to the three AI agents and stores the scores.
5. View the dashboard
python -m dash_app.appOpen http://127.0.0.1:8050 and explore the results.
Scaling Up with Celery
For larger batches, swap the sequential processing for distributed Celery workers:
# Start Redis (the message broker)
brew services start redis

# In separate terminals:
celery -A deploy.tasks_inputs worker --loglevel=INFO --concurrency=6
celery -A deploy.tasks_eval worker --loglevel=INFO --concurrency=10

# Enqueue work
python deploy/enqueue_input_tasks.py --input-source samples/f1_sample.csv
python deploy/enqueue_eval_tasks.py --override
Concurrency is up to you - bump it based on your hardware and server capacity.
Customizing for Your Use Case
One of the project's strengths is how little code you need to change to adapt it. The evaluation logic lives entirely in HOCON configuration files - not Python.
Want to change the scoring rubric?
Edit registries/f1_fan_knowledge.hocon and adjust the grounding instructions.
Want to switch LLM models?
Change "use_model": "gpt-4o" to "claude-3-5-sonnet" or any model Neuro-san supports.
Want to add a new evaluation dimension?
Create a new HOCON agent file, register it in manifest.hocon, add the score field to the database schema, and update SCORE_FIELDS in process_eval.py. The dashboard auto-discovers new columns.
Want to evaluate something entirely different?
This architecture isn't limited to F1. The same pattern works for evaluating essays, product reviews, hackathon submissions, customer feedback - anything where you need multi-dimensional or multi-modal AI assessment at scale. Our earlier project, VibeCodingEval, used the same core architecture to evaluate 30,000+ multi-modal hackathon submissions (code, video and text pitch) across seven dimensions (innovation, UX, scalability, market potential, and more), processing them in just 15 hours - work that would have taken 8 full-time employees over a year.
Best Practices and What's Next
Building multi-agent evaluation systems has taught us a few things worth sharing:
One agent per rubric dimension. This is the single most important design decision for explainability. When a score seems wrong, you know exactly which agent to investigate and which sub-criteria to tune.
Deterministic math, probabilistic reasoning. Let the LLM do what it's good at (nuanced assessment, generating rationale) and let Python code do the math (averaging scores, validating ranges). The sly_data pattern in Neuro-san makes this separation clean.
Track everything. Every evaluation records not just scores but token counts, API costs, and processing times. This isn't overhead - it's essential for understanding system behavior at scale and catching regressions.
Design for re-evaluation. Rubrics evolve. Models improve. The --override flag lets you re-run evaluations with updated agents without losing historical data. Always keep this door open.
Choice of backend db. The system defaults to SQLite for zero-configuration local development, but environment variable swap puts you on PostgreSQL for concurrent, production workloads.
Async with guardrails. The evaluation pipeline uses asyncio for parallelism, but a semaphore caps concurrent AI agent requests. Without this, you'll either overwhelm the server or hit rate limits.
Try It Out
The project is open source and ready to use:
neuro-san-studio (This is where you can start): github.com/cognizant-ai-lab/neuro-san-studio
neuro-san: github.com/cognizant-ai-lab/neuro-san
This project's Repository: github.com/deepsaia/f1-fan-eval
Clone it, bring your own fan submissions (or use the included samples), customize the rubrics, and see what the AI thinks of your F1 fandom. Whether you're building a fan contest, a content evaluation pipeline, or just want to explore multi-agent AI orchestration - this is a solid starting point.
After all, in Formula 1 and in software - it's all about getting the setup right before the lights go out.

Deepak is a data scientist that specializes in machine learning, applied statistics, and data-driven applications such as multi-agent systems.